![]()
Dear data analysts,
thinking and design belong together. If creating a comparison is the challenge at hand, then the chart should do exactly this. The principles of analytic design are the principles of reasoning about evidence. They are about visual thinking. Good design is the visualization of clear thinking.
Multiple charts (Small Multiples) offer a compact, repetitive presentation of several variables, just as Galileo used for his observations of Saturn. This high information density makes it easy for us to understand their message. If an observer understands the general principle, he will understand the other illustrations as well. Their credibility is also very high because they always show all the data that is available. The general principles behind the individual charts just need to be clear and simple.
We’re proud to introduce the concept of Small Multiples in DeltaMaster, accommodating our aspiration for straightforward, serious, modest, and matter-of-fact reporting.
Have a wonderful Christmas time and a good start into the new year!
Your Bissantz & Company Team
Good design gets even better when it is repeated. DeltaMaster has always been rich in methods to create meaningful analytical reports. You can get especially information-dense and easy-to-understand reports when you combine several similar representations to a single report. This is the idea of Small Multiples, a new analysis method which is available since DeltaMaster 5.3.7 in the Miner Expert mode.
This method automatically creates reports containing several ‘multiples’ or similar report parts. For example, it could contain pivot tables with the same structures or several rankings with the same construction. Similar to a combination cockpit, an analysis template or cockpit serves as a basis. DeltaMaster then iterates the calculation of this template for multiple measures, members or dimensions to answer the same question for different report components. It automatically formats these multiples and displays them on the screen. Visualization elements may be used globally or individually for each part of the report.
Several names for his concept are conceivable, for instance multiple charts, multi-charts or tile chart. If one refers to only one part of the overall report, one may talk of a subreport, a (diagram) tile, or “a multiple”.
The following sequence from our ”Chair” reference model shows an example about how Small Multiples reports can be constructed and what differentiates them from other methods. The starting point is a simple pivot table you’ve created as a cockpit.
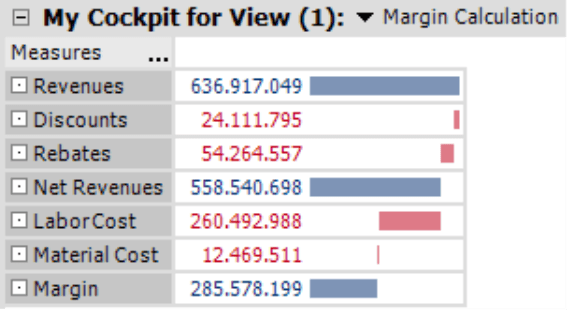
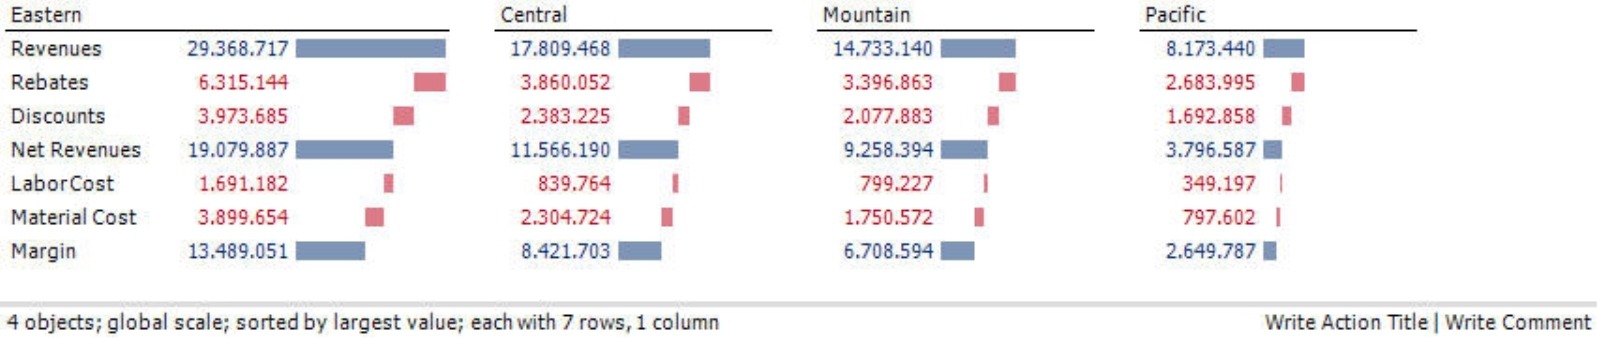
Using Small Multiples, you can create a report that shows the margin for each of our customer regions (Central, Mountain, Eastern, and Pacific time zones) with just a few clicks of a mouse.
DeltaMaster automatically groups these four report components into the allotted space on your screen.
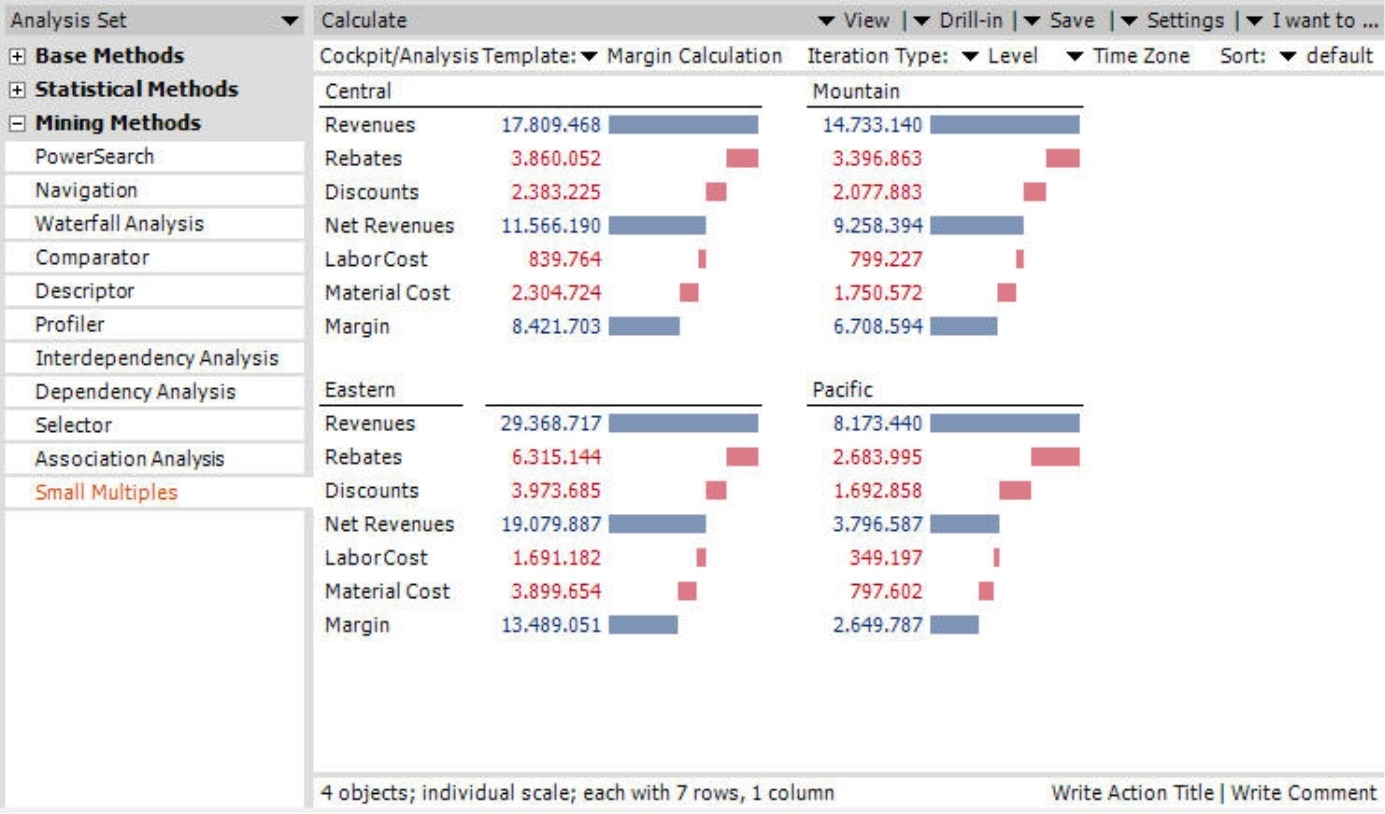
Depending on how you partition your screen, you could view four multiples in a single row.
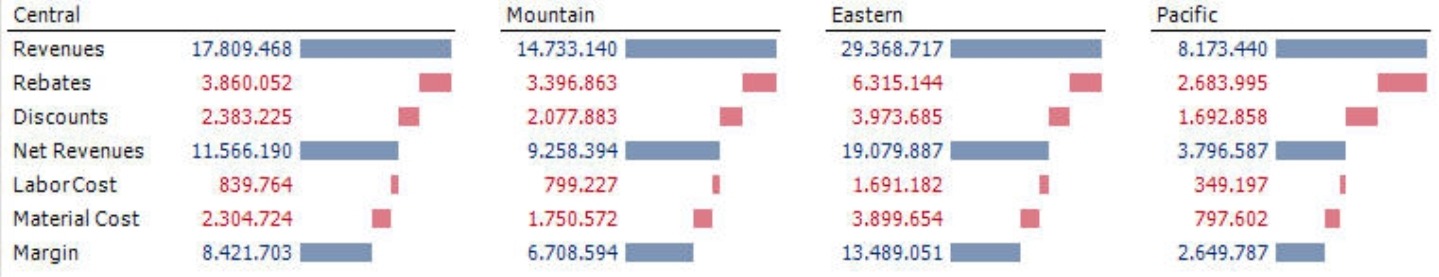
Whenever there would be redundancy and thus a waste of space, DeltaMaster automatically omits labels. The seven measures, therefore, only appear at the beginning of each row because they would be identical in all four multiples in that row.
Until now, the bars of the waterfall chart are scaled individually for each tile. In order to compare the segments, you could also apply a uniform, global scale to the bars of the waterfall charts to visualize the relative size of each bar’s length in relation to all multiples in that report and not just a single one.
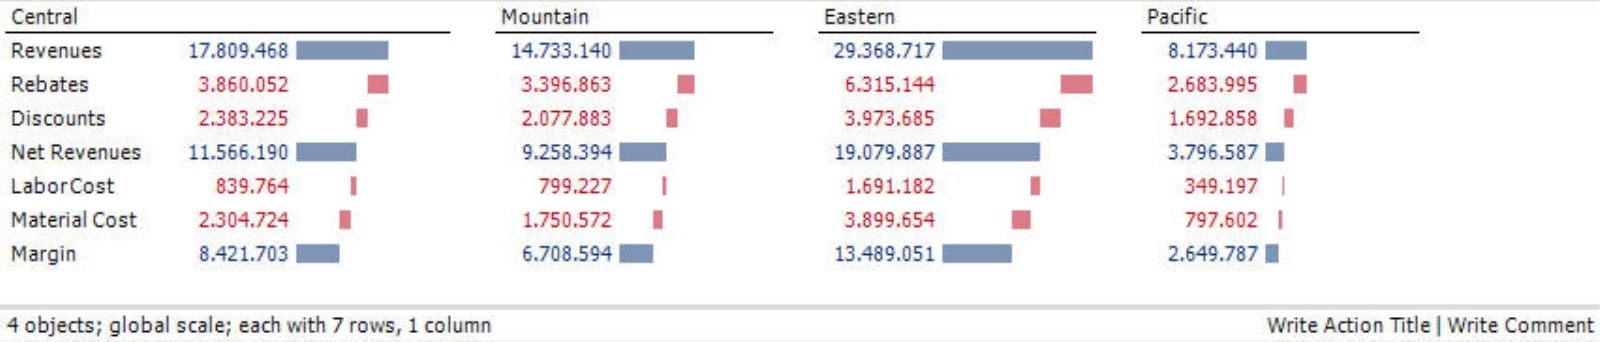
DeltaMaster hints on the current scale in the status bar below the report.
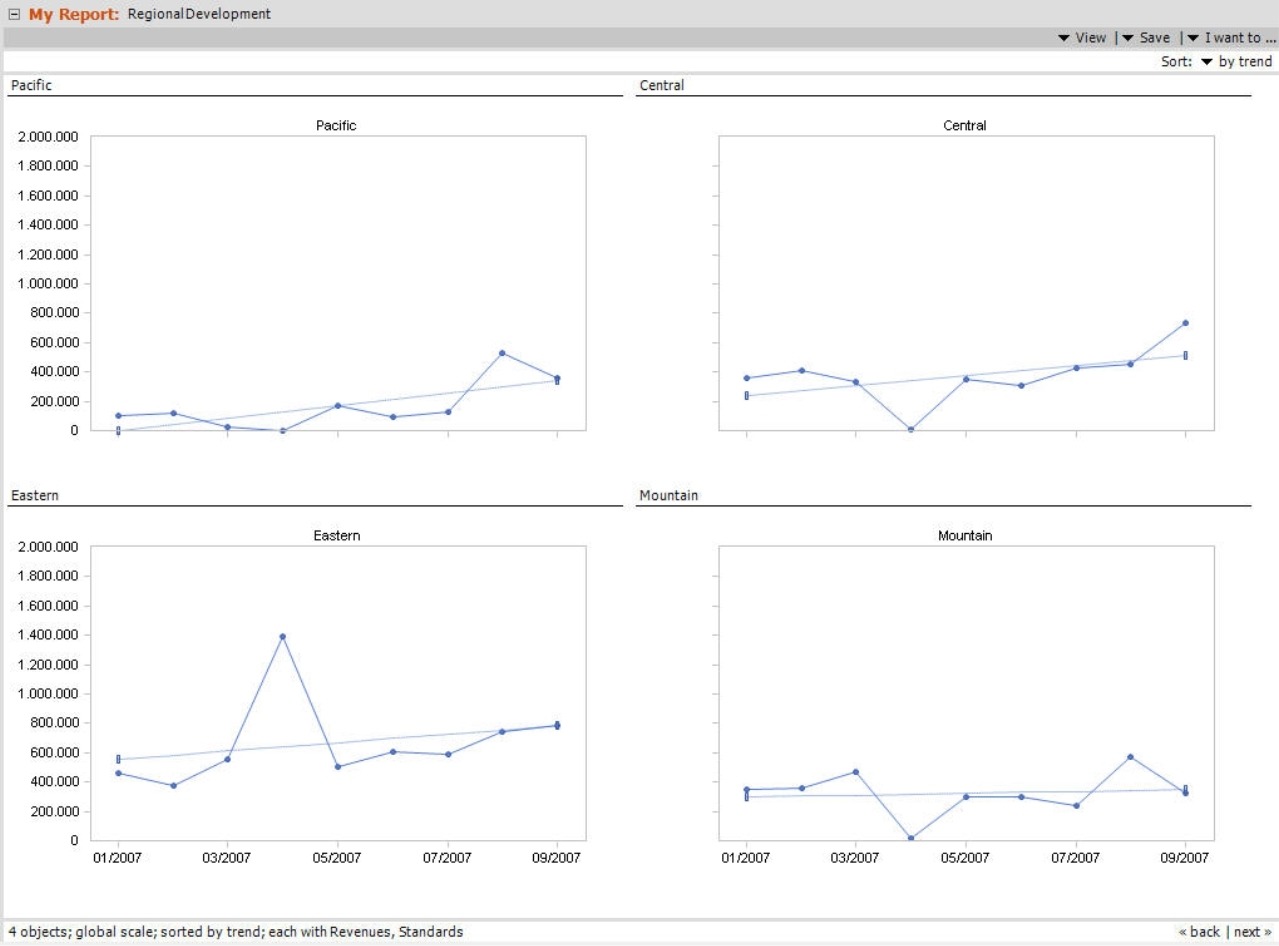
Finally, you could also organize the report parts based on their values so that the strongest region – in this case, Eastern – appears first and the weakest one – Pacific – comes last.
Multiplying made easy – creating Small Multiples reports
To multiply cockpits and analysis templates, only three simple steps are required. They can all be taken within the header of the My Analysis window.
![]()
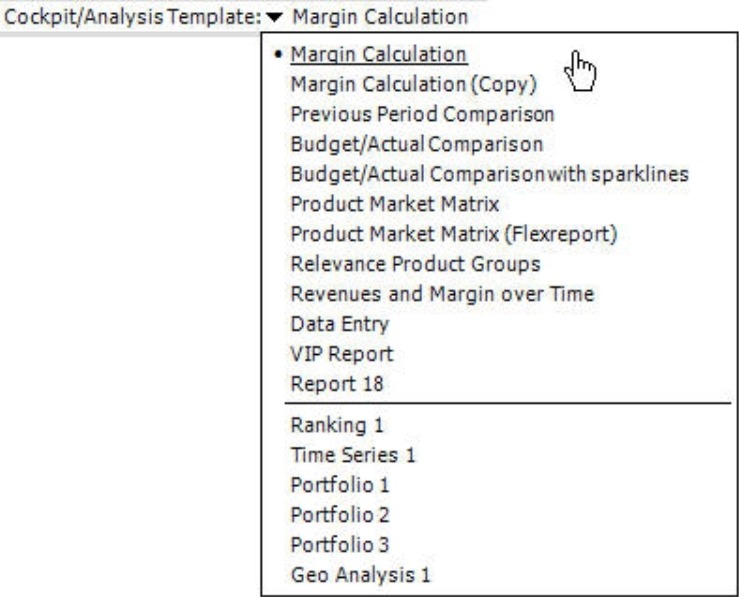
First, you simply select the template that should be repeated (i.e. iterated) for the multiple, under Cockpit/Analysis Template. Here you can choose either an existing cockpit (based on a pivot table or Flexreport) or an analysis template (where DeltaMaster saves the settings of the analysis methods; discussed in more detail in the December 2005 issue of DeltaMaster clicks!). The upper part of the list displays the possible cockpits while the bottom section shows the analysis templates.
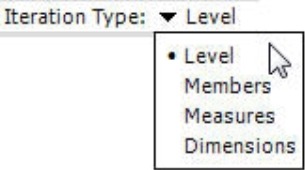
In the second step, you determine what type of repetition you would like to use – i.e. what should be different from tile to tile – underIteration type. DeltaMaster can calculate each part of the report for a different member or measure. To repeat the tiles for multiple dimension members, select either Levels or Members. If you want to calculate the template with different measures – for example, sales, revenues and margin – select Measures. If you choose to repeat by Dimensions, each tile will perform the same analysis within a different dimension.
Third, you select which members, measures or dimensions you would like to use in your report, depending on the selected iteration type.
Multiplication manifold – the iteration types
The differences between the various iteration types are most obvious when using the Ranking method which is supported by all iteration types (see also the table further down).
First, you create a top 5 product ranking by revenues as usual and save it as an analysis template to be used as a basis for the Small Multiples.
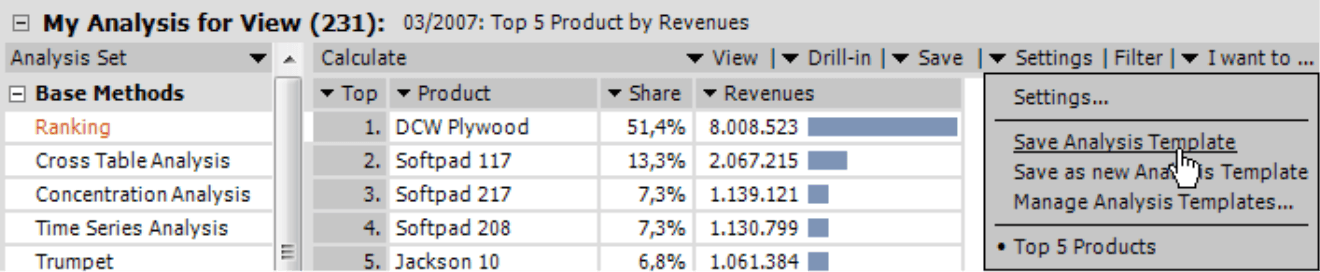
In this report, we have iterated the ranking over the “time zones“ level in our customer dimension.
DeltaMaster has then changed the view internally to the Central, Mountain, Eastern, and Pacific time zone, calculated the ranking for each step and automatically arranged the results on the report pane. The scale still is individual for each chart here.

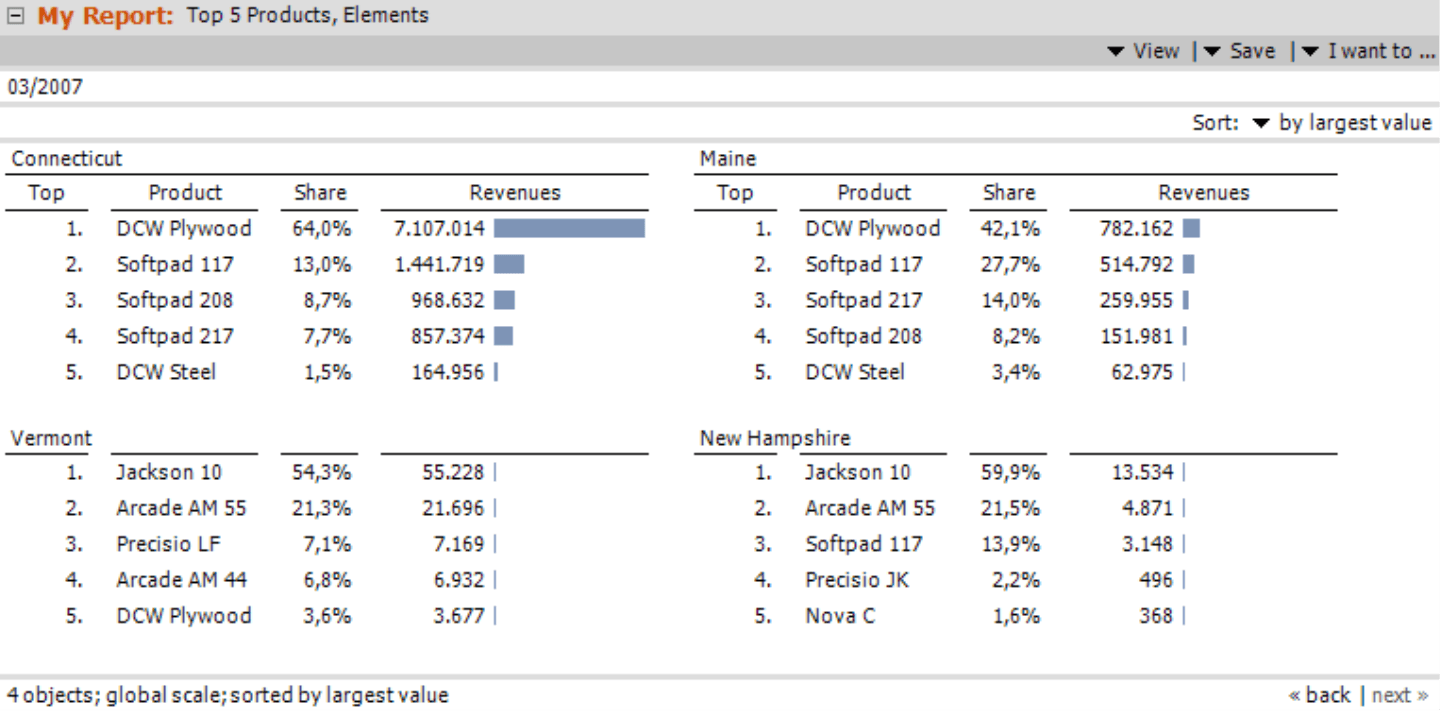
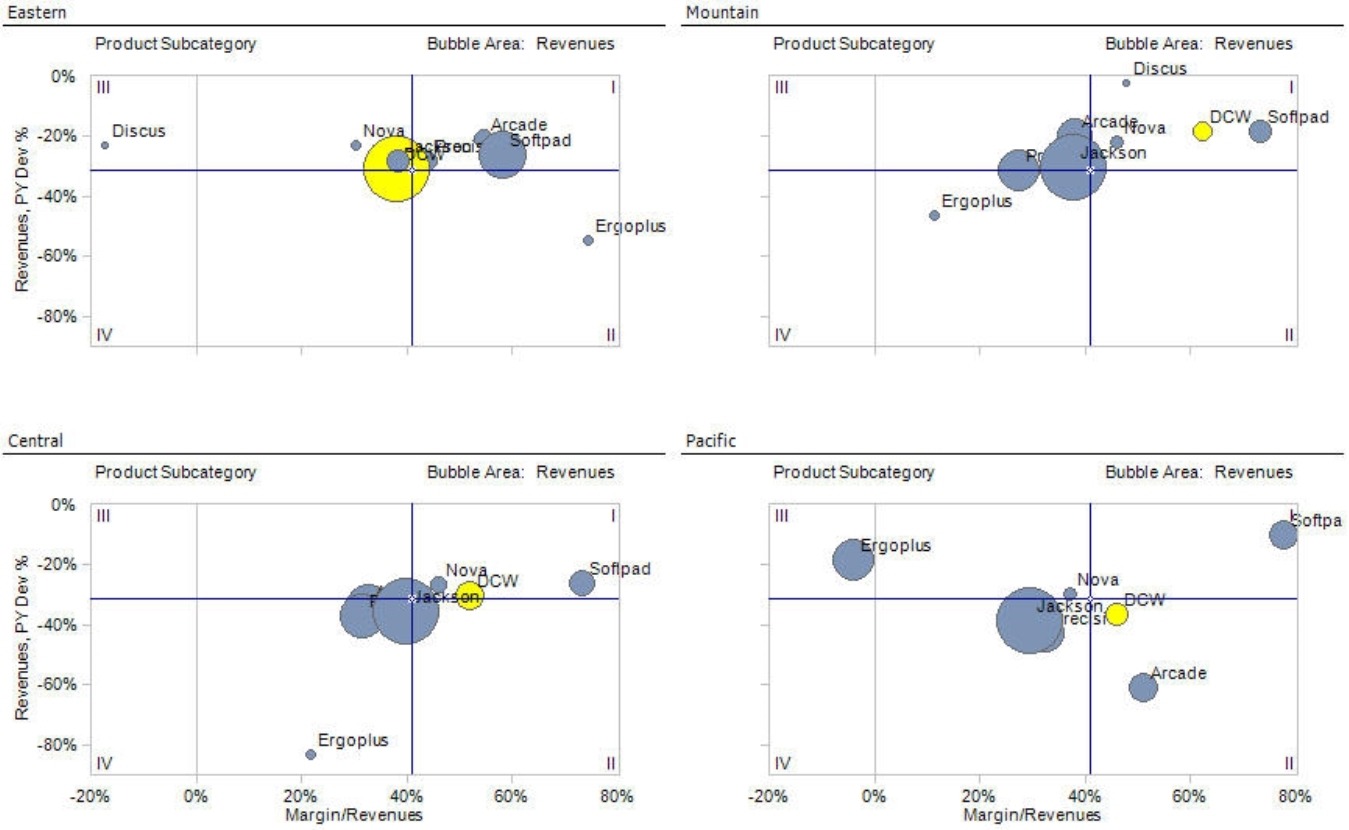
In the image on the right, several members are iterated as well; contrary to before, they were selected manually instead of via their dimension level. This resembles selecting members in a pivot table; here, too, it is possible to pick entire levels or individual elements. The scale is now global so that all bars are painted in the same scale and are thus comparable. The order of the subreports is based on analytical logic, too: The multiple with the largest value stands first, the others follow sorted descendingly.
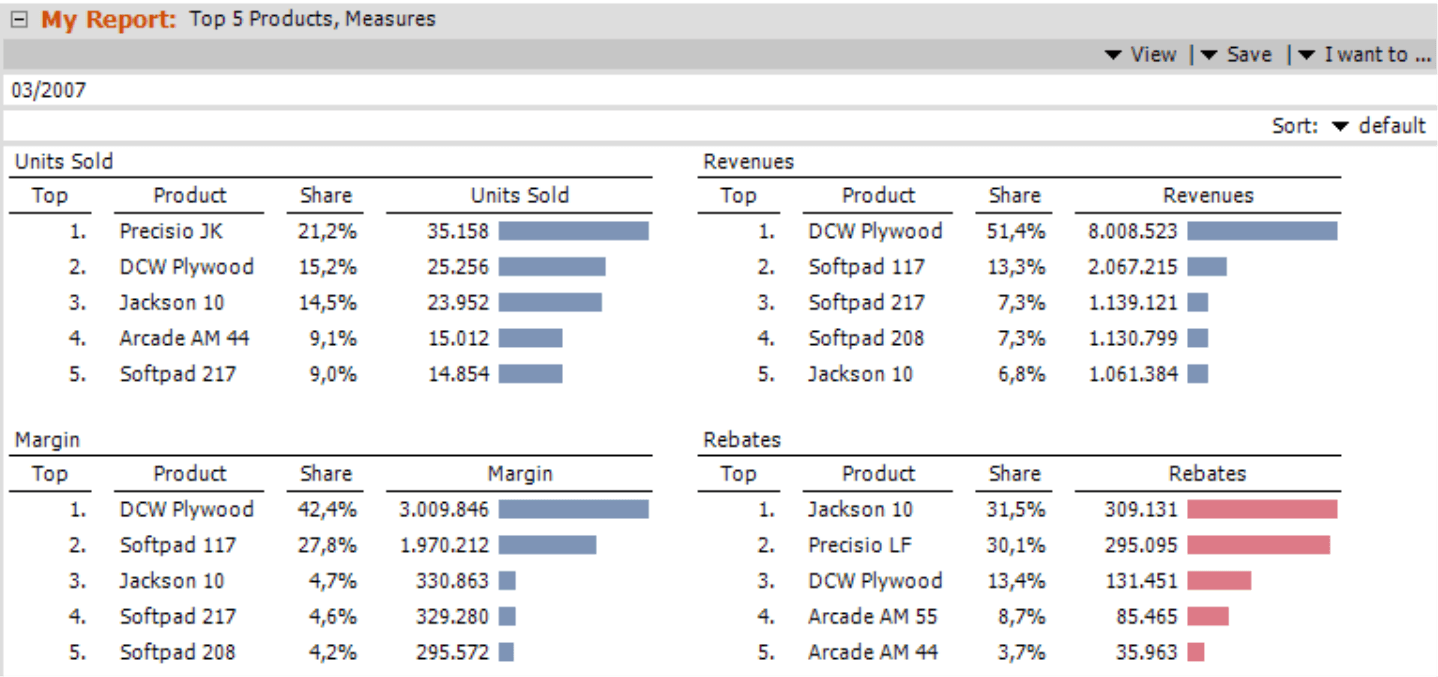
With the third iteration type, measures, the business indicator is varied. The multi-chart reveals at first glance that the products that have the highest numbers of sold units are not necessarily the ones with the biggest contribution margin. Technically, the measure that has originally been saved in the analysis template is ”overruled“.
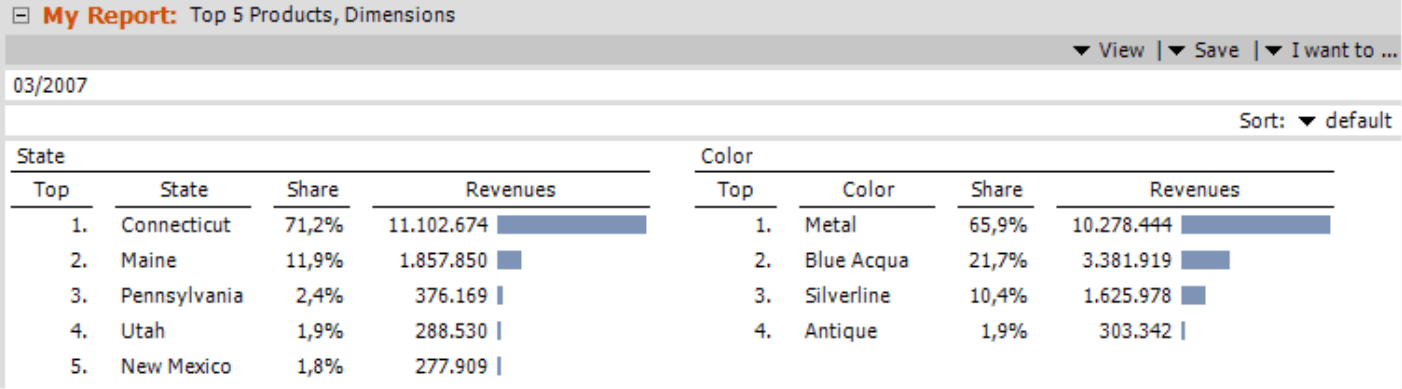
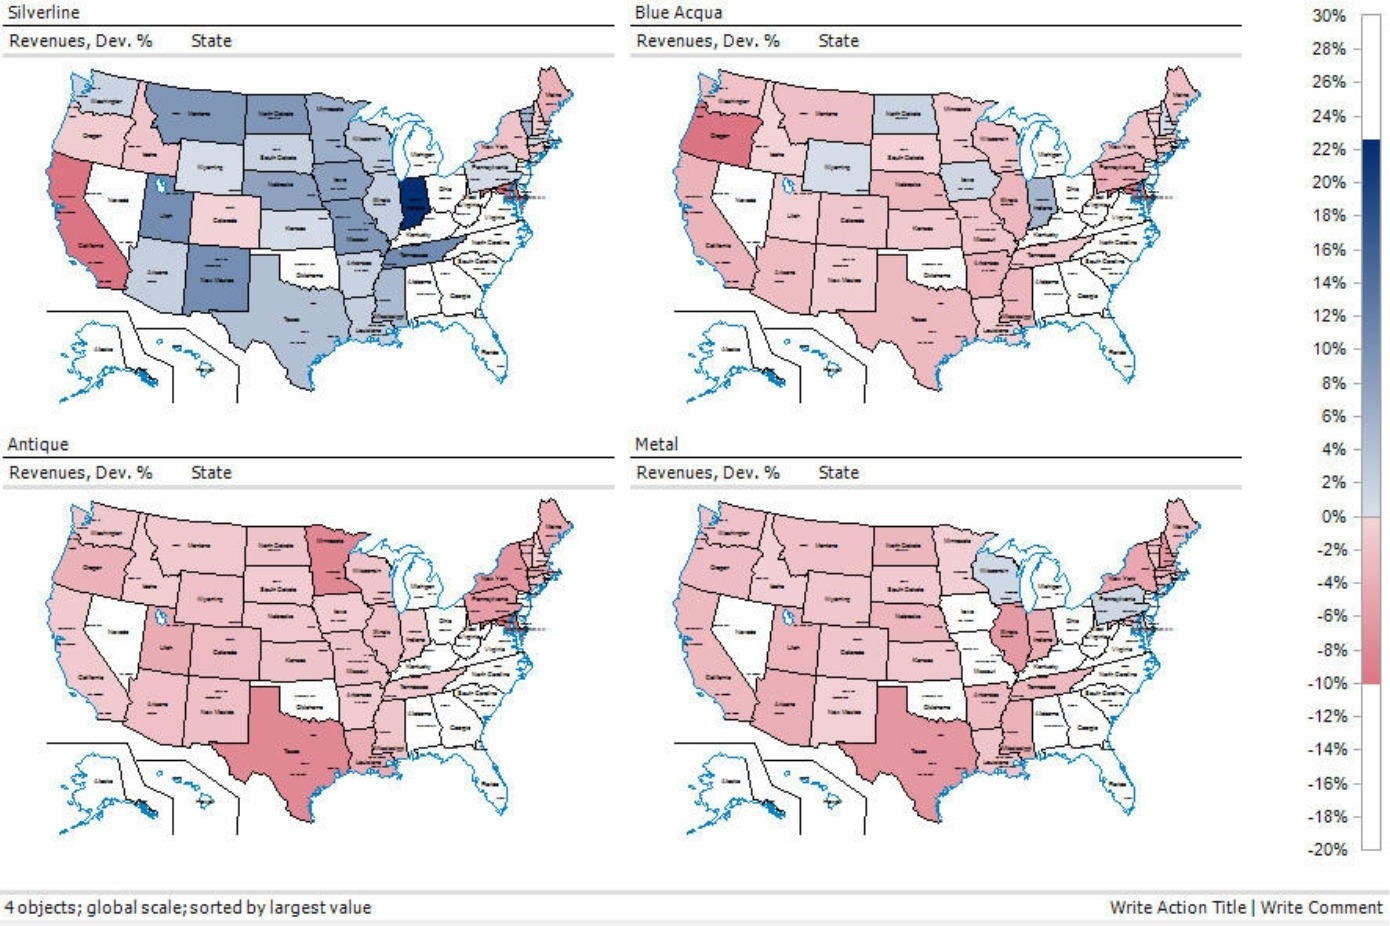
With the fourth iteration type, dimensions, you vary the dimension or hierarchy stored in the analysis template. For example, you get the two analyses shown on the right, depicting the results using the customer dimension’s “State” level and the color dimension.
Supported cockpit types and analysis methods
The following table shows which combinations of Small Multiple templates and iterations DeltaMaster currently supports:
| Levels | Members | Measures | Dimensions | |
Pivot tables |
+ | + | ||
Flexreports |
+ | + | ||
Rankings |
+ | + | + | + |
Cross table analysis |
+ | + | (+)1 | + |
Time series analysis |
+ | + | + | |
Portfolio analysis |
+ | + | + | |
Geo analysis |
+ | + | ||
PowerSearch |
+ | + | + | + |
| 1 cross tables containing only one measure | ||||
Further examples
When multiplying analysis results, Small Multiples consider the features and distinctivenesses of the individual methods.
For instance, in multiplied time series, several scaling options are available.
Selected objects are highlighted in all portfolio tiles, e.g. in order to show shifts in position.
In multiplied Geo analyses, a global color schema helps to keep the individual maps comparable.
From the “Expert“ to everyone
Like all other report types, a Small Multiples report can be annotated, and Action Titles can be added. The result can be exported to Microsoft Word, Excel, PowerPoint, or as a PDF document, saved into the repository for the DeltaMaster WebOption, and certainly called in the briefing book in all DeltaMaster modes from Offline Reader all the way up to Miner Expert. Only to create and modify Small Multiples, a Miner Expert license is required. If you want to try the new features, we’ll be pleased to provide you with an evaluation license; just send an e-mail to service@bissantz.com.
Kommentare
Sie müssten eingeloggt sein um Kommentare zu posten..